How Can One Analyze Forex Trading Charts?
Forex trading charts are a valuable tool for analyzing market trends and making informed trading decisions. By effectively analyzing these charts, traders can gain insights into price movements and identify potential trading opportunities. In this blog post, we will explore the key steps to analyze forex trading charts.
1. Understanding Different Chart Types
The first step in analyzing forex trading charts is to understand the different chart types available. The most commonly used chart types are line charts, bar charts, and candlestick charts. Each chart type has its advantages and provides different levels of detail. Traders should choose the chart type that suits their trading style and preferences.
2. Studying Price Action
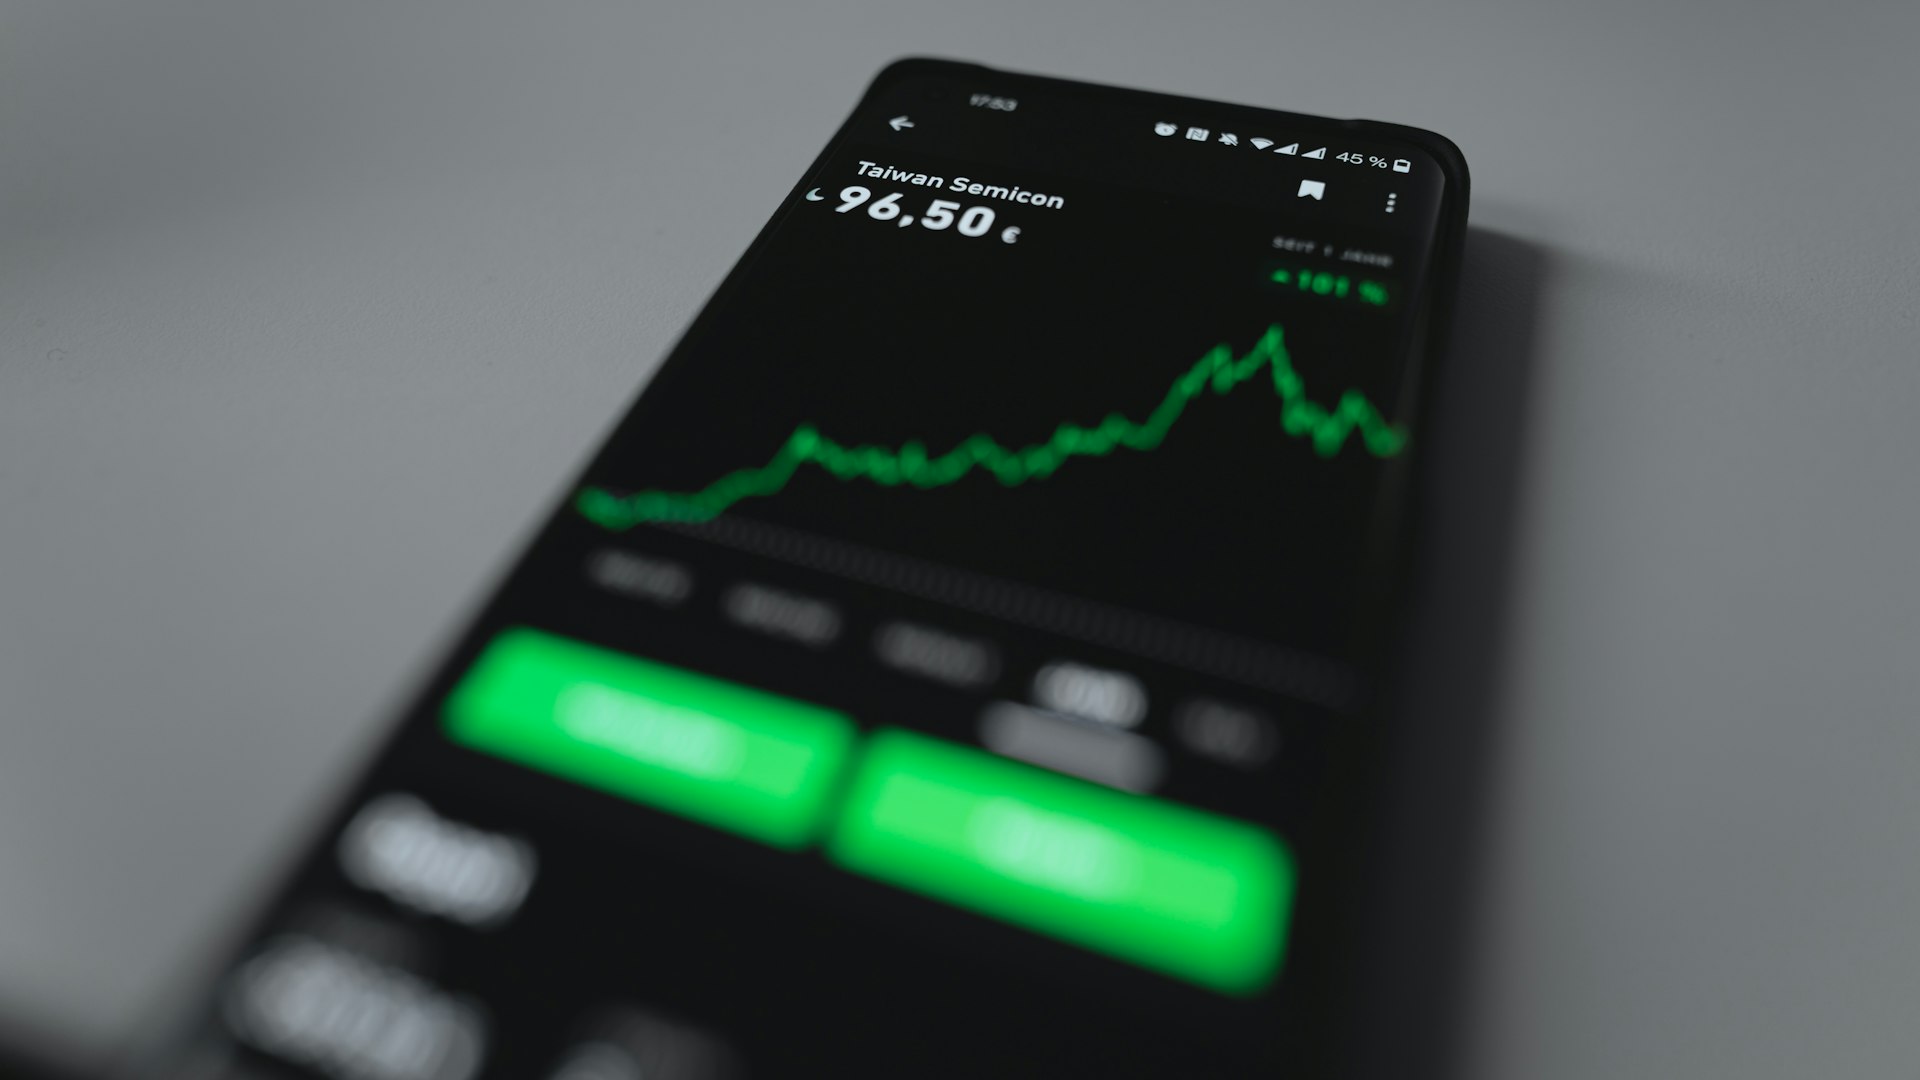
Price action analysis involves studying the movement of prices on the chart without relying on indicators or oscillators. By observing patterns, trends, and key levels, traders can gain insights into market sentiment and potential price reversals. Price action analysis can be done by identifying support and resistance levels, trendlines, chart patterns, and candlestick formations.
3. Using Technical Indicators
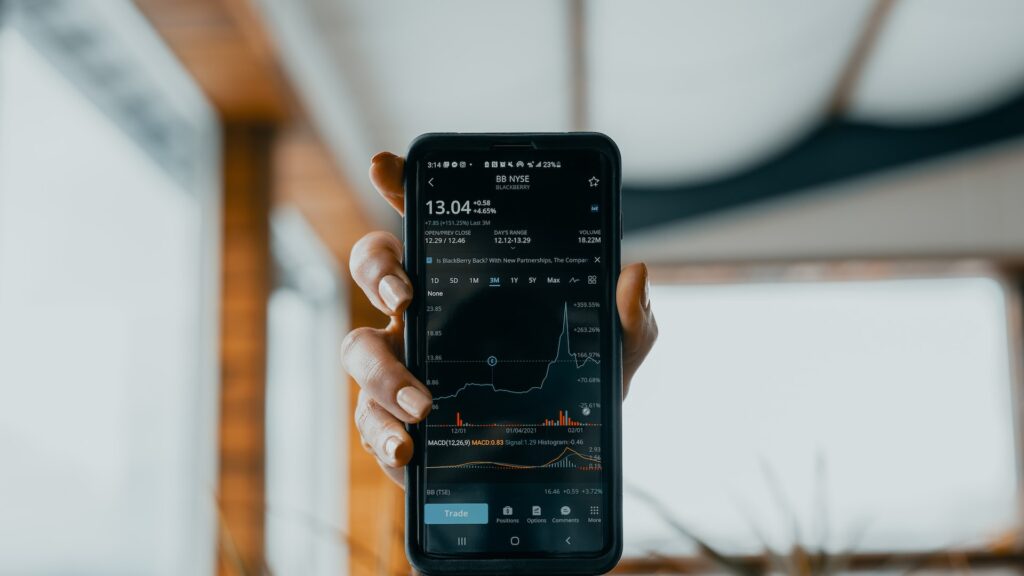
Technical indicators are mathematical calculations based on historical price and volume data. They help traders analyze market trends, identify potential entry and exit points, and generate trading signals. Popular technical indicators include moving averages, Relative Strength Index (RSI), and MACD (Moving Average Convergence Divergence). Traders should choose indicators that align with their trading strategy and use them to complement their analysis.
4. Identifying Support and Resistance Levels
Support and resistance levels are key areas on a chart where prices tend to stall or reverse. These levels can be identified by drawing horizontal lines on the chart at points where prices have historically struggled to break through. Support levels act as a floor, preventing prices from falling further, while resistance levels act as a ceiling, preventing prices from rising higher. Traders can use these levels to make trading decisions, such as entering or exiting positions.
5. Recognizing Chart Patterns
Chart patterns are recurring formations on a price chart that indicate potential trend reversals or continuations. Common chart patterns include triangles, head and shoulders, double tops, and double bottoms. By recognizing these patterns, traders can anticipate future price movements and adjust their trading strategy accordingly. It’s important to study and familiarize yourself with different chart patterns to effectively analyze forex trading charts.
6. Analyzing Multiple Timeframes
Forex traders should analyze charts across multiple timeframes to gain a comprehensive view of the market. While shorter timeframes provide detailed information for short-term trading, longer timeframes offer a broader perspective for long-term analysis. Traders can use higher timeframes to identify major trends and lower timeframes to pinpoint entry and exit points. By analyzing multiple timeframes, traders can make more informed and well-rounded trading decisions.
7. Practicing Risk Management
Effective chart analysis alone is not enough for successful forex trading. It’s crucial for traders to implement proper risk management techniques. Set stop-loss orders to limit potential losses and take-profit orders to secure profits. Additionally, calculate and manage your risk-to-reward ratio for each trade. By incorporating risk management principles into your analysis and trading strategy, you can protect your capital and increase your chances of long-term success.
8. Conclusion
Analyzing forex trading charts is an essential skill for traders looking to make informed trading decisions. By understanding different chart types, studying price action, using technical indicators, identifying support and resistance levels, recognizing chart patterns, analyzing multiple timeframes, and practicing effective risk management, traders can enhance their chart analysis skills. Regular practice, continuous learning, and experience are also crucial in becoming proficient in analyzing forex trading charts. By mastering the art of chart analysis, traders can gain a competitive edge and improve their overall trading performance.