Why Are Charts Important in Forex Trading?
Charts play a crucial role in forex trading as they provide traders with valuable insights into market trends, patterns, and potential price movements. By analyzing and interpreting these charts, traders can make informed decisions and improve their chances of success. In this blog post, we will explore the importance of charts in forex trading and how they can benefit traders.
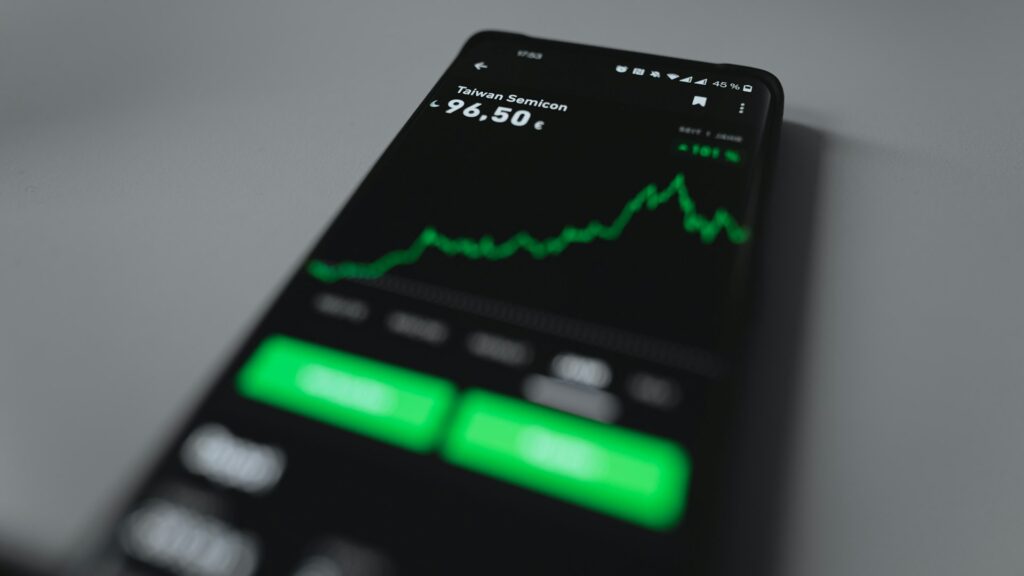
1. Visual Representation of Price Data
Charts provide a visual representation of price data, allowing traders to see how prices have changed over time. This visual representation makes it easier to identify patterns, trends, and support/resistance levels. By studying these patterns, traders can predict potential market movements and adjust their trading strategies accordingly.
2. Identification of Trends
One of the key benefits of using charts in forex trading is the ability to identify trends. Trends are the general direction in which prices are moving over a given period. By analyzing charts, traders can determine whether the market is in an uptrend (rising prices), a downtrend (falling prices), or a sideways trend (prices moving within a range). Identifying trends is crucial as traders can align their trades with the prevailing trend, increasing their chances of profitability.
2.1 Types of Trends
There are three main types of trends that traders look for:
2.1.1 Uptrend
An uptrend is characterized by a series of higher highs and higher lows. In an uptrend, prices are generally rising, indicating a bullish market sentiment. Traders can look for opportunities to buy or go long in an uptrend.
2.1.2 Downtrend
A downtrend is characterized by a series of lower highs and lower lows. In a downtrend, prices are generally falling, indicating a bearish market sentiment. Traders can look for opportunities to sell or go short in a downtrend.
2.1.3 Sideways Trend
A sideways trend, also known as a range-bound market, occurs when prices move within a horizontal range. In a sideways trend, prices are neither rising nor falling significantly. Traders can look for opportunities to buy at support levels and sell at resistance levels within the range.
3. Identification of Chart Patterns
Charts also help traders identify chart patterns, which are specific formations that often precede price movements. These patterns can provide valuable insights into potential market reversals or continuations. Some common chart patterns include:
3.1 Head and Shoulders
The head and shoulders pattern consists of a central peak (head) with two smaller peaks (shoulders) on either side. This pattern often signals a potential trend reversal, with the price expected to move in the opposite direction after the pattern completes.
3.2 Double Tops and Bottoms
Double tops and bottoms occur when the price reaches a certain level twice, but fails to break through. A double top pattern indicates a potential trend reversal from an uptrend to a downtrend, while a double bottom pattern suggests a potential reversal from a downtrend to an uptrend.
4. Timing of Trades
Charts help traders determine the optimal timing for their trades. By analyzing charts, traders can identify potential entry and exit points based on support and resistance levels, trendlines, and other technical indicators. This allows traders to enter trades at favorable prices and maximize their potential profits.
5. Risk Management
Charts are essential for effective risk management in forex trading. By analyzing charts, traders can set appropriate stop-loss orders and take-profit levels based on key support and resistance levels. This helps traders limit their potential losses and protect their capital.
Conclusion
Charts are a vital tool for forex traders as they provide valuable insights into market trends, patterns, and potential price movements. By utilizing charts effectively, traders can make informed decisions, identify profitable trading opportunities, and manage risk more effectively. Whether you are a beginner or an experienced trader, understanding and interpreting charts is essential for success in forex trading.