

Introduction
Forex live charts are essential tools for traders to analyze currency markets in real-time. They provide valuable visual representations of price movements, allowing traders to make informed trading decisions. In this blog post, we will explore the different types of forex live charts and how they work, enabling traders to effectively analyze market trends and patterns.
1. Line Charts
Line charts are the simplest type of forex live charts. They display the closing prices of currency pairs over a specific time period, connecting each closing price with a line. Line charts provide a clear depiction of the overall trend and help identify support and resistance levels. However, they lack the detailed information provided by other chart types.
2. Bar Charts
Bar charts, also known as OHLC (Open-High-Low-Close) charts, provide more detailed information compared to line charts. Each bar represents a specific time period and displays the opening and closing prices as well as the highest and lowest prices during that period. Bar charts help traders identify price ranges, trends, and potential reversals. The length and position of the bars relative to each other provide valuable insights into market dynamics.
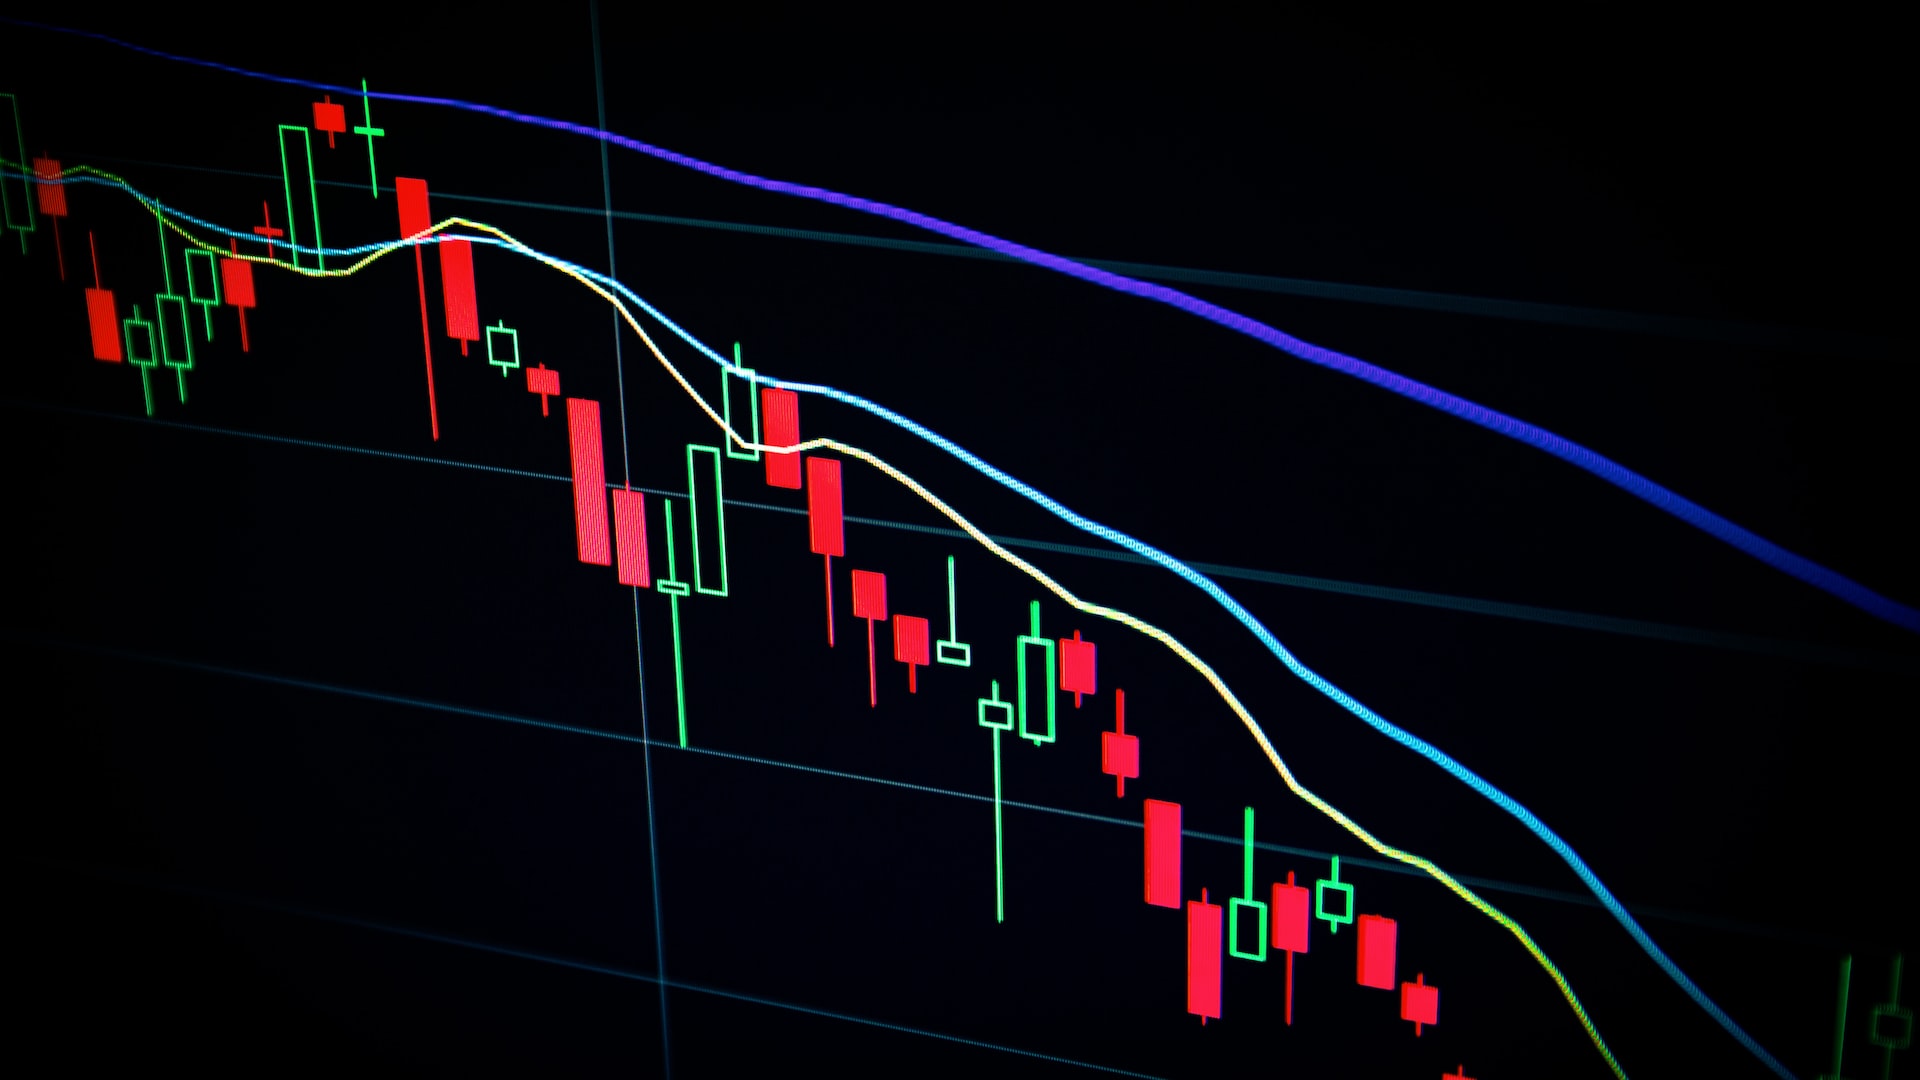
3. Candlestick Charts
Candlestick charts are similar to bar charts but offer additional visual cues about market sentiment. Each candlestick represents a specific time period and displays the opening, closing, highest, and lowest prices. The body of the candlestick is filled or hollow, indicating whether the closing price is higher or lower than the opening price. Candlestick charts provide valuable information about price patterns, trend reversals, and market psychology.
4. Renko Charts
Renko charts are unique because they focus solely on price movements. They disregard time and only consider significant price changes. Each brick on a Renko chart represents a specific price movement, and a new brick is formed only when the price surpasses a predefined threshold. Renko charts filter out market noise and help traders identify trends and reversals more clearly. They are particularly useful for traders who prefer a simplified view of price action.
5. Point and Figure Charts
Point and Figure charts are another type of forex live charts that filter out minor price movements and focus only on significant price changes. Instead of using a time axis, they use columns of Xs and Os to represent price movements. Xs represent rising prices, while Os represent falling prices. Point and Figure charts help traders identify support and resistance levels, trends, and potential breakouts.
Conclusion
Forex live charts come in various types, each offering unique benefits for traders. Line charts provide a simple view of price trends, while bar charts and candlestick charts offer more detailed information about price ranges, trends, and reversals. Renko and Point and Figure charts filter out noise and focus on significant price movements. By understanding the different types of forex live charts and how they work, traders can effectively analyze market trends, patterns, and price dynamics, leading to more informed trading decisions.