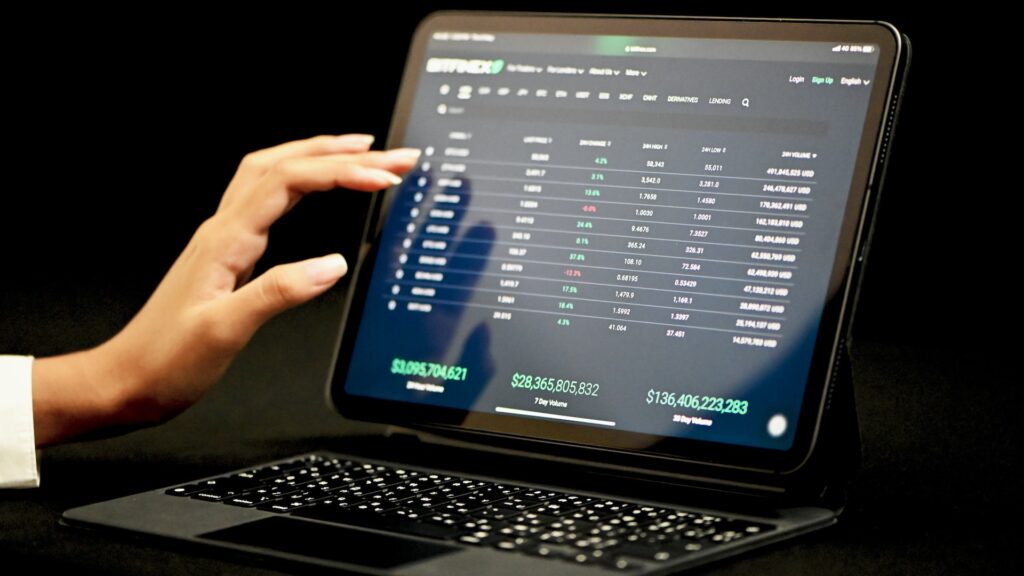
What is technical analysis in forex trading?
Technical analysis is a widely used approach in forex trading that involves the study of historical price data to predict future price movements. Traders who employ technical analysis believe that past price patterns, trends, and market behavior can provide insights into the future direction of currency pairs. In this blog post, we will delve into the concept of technical analysis and its significance in forex trading.
Section 1: Understanding Technical Analysis
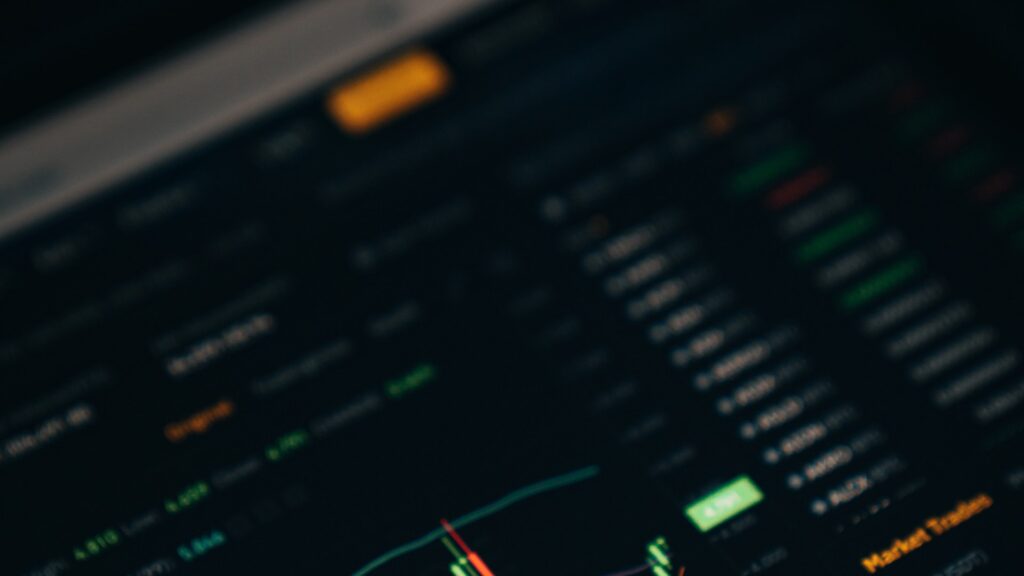
Technical analysis is a method of analyzing financial markets that focuses on price charts and other technical indicators. It assumes that all relevant information about a currency pair is reflected in its price and volume data, making fundamental factors less significant in the analysis process. Traders who use technical analysis aim to identify patterns and trends that can guide their trading decisions.
Section 2: Key Principles of Technical Analysis
There are several key principles that form the foundation of technical analysis:
Subsection 2.1: Market Discounts Everything
The principle of “market discounts everything” suggests that all relevant information, including economic data, news, and market sentiment, is already reflected in the price of a currency pair. Technical analysts believe that studying historical price patterns can help predict future price movements.
Subsection 2.2: Price Moves in Trends
Technical analysis is based on the belief that prices move in trends, whether they are upward (bullish), downward (bearish), or sideways (consolidation). Traders use various tools and indicators to identify and follow these trends, aiming to enter trades in the direction of the prevailing trend.
Subsection 2.3: History Repeats Itself
The principle of “history repeats itself” suggests that price patterns and trends observed in the past are likely to occur again in the future. Technical analysts study historical price data to identify recurring patterns that can help predict future price movements.
Section 3: Tools and Indicators Used in Technical Analysis
Technical analysts use a wide range of tools and indicators to analyze price charts and make trading decisions. Some commonly used tools include:
Subsection 3.1: Support and Resistance Levels
Support and resistance levels are price levels at which a currency pair has historically had difficulty moving below (support) or above (resistance). Traders use these levels to identify potential entry and exit points, as prices are expected to react when approaching these levels.
Subsection 3.2: Moving Averages
Moving averages are calculated by averaging a currency pair’s prices over a specific period. They help identify trends and smooth out price fluctuations. Traders often use moving averages to confirm the direction of a trend and generate trading signals.
Subsection 3.3: Oscillators
Oscillators, such as the Relative Strength Index (RSI) and Stochastic Oscillator, help traders identify overbought and oversold conditions in the market. These indicators can signal potential trend reversals or continuation, providing valuable insights for traders.
Section 4: Limitations of Technical Analysis
While technical analysis is widely used, it is important to acknowledge its limitations:
Subsection 4.1: Incomplete Information
Technical analysis relies solely on price and volume data, which may not capture all relevant information about a currency pair. Economic events, news, and geopolitical factors can have a significant impact on forex markets but may not be reflected in price charts.
Subsection 4.2: Subjectivity
Technical analysis involves interpreting patterns and indicators, which can be subjective to some extent. Different traders may interpret the same chart differently, leading to varying trading decisions.
Section 5: Conclusion
Technical analysis is a widely used approach in forex trading, focusing on historical price data to predict future price movements. Traders who employ technical analysis study price charts and use various tools and indicators to identify patterns, trends, and potential trading opportunities. While technical analysis has its limitations, it remains a valuable tool in the arsenal of forex traders, providing insights and guidance for their trading decisions.