Exploring the Best Indicators for Forex Analysis
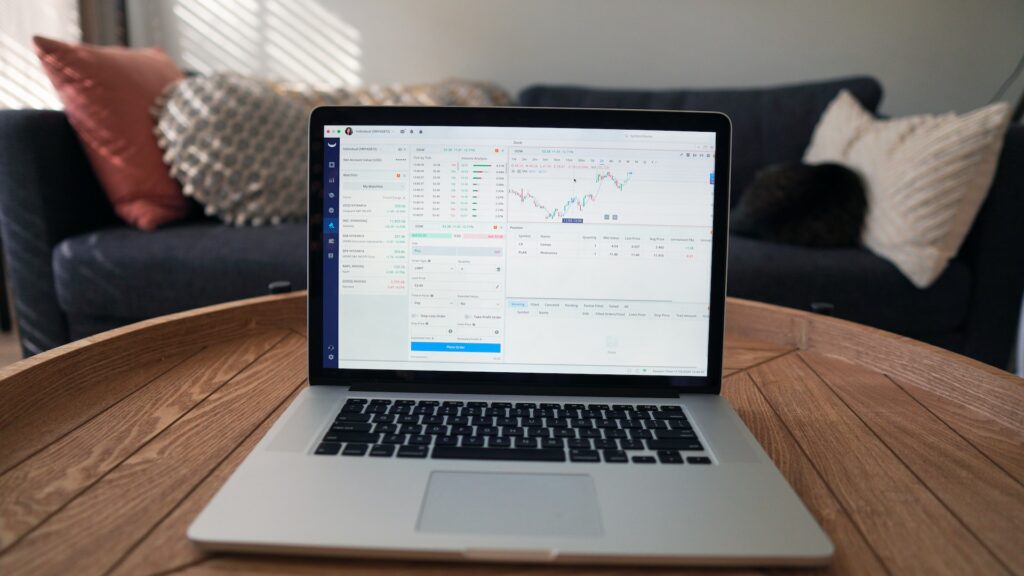
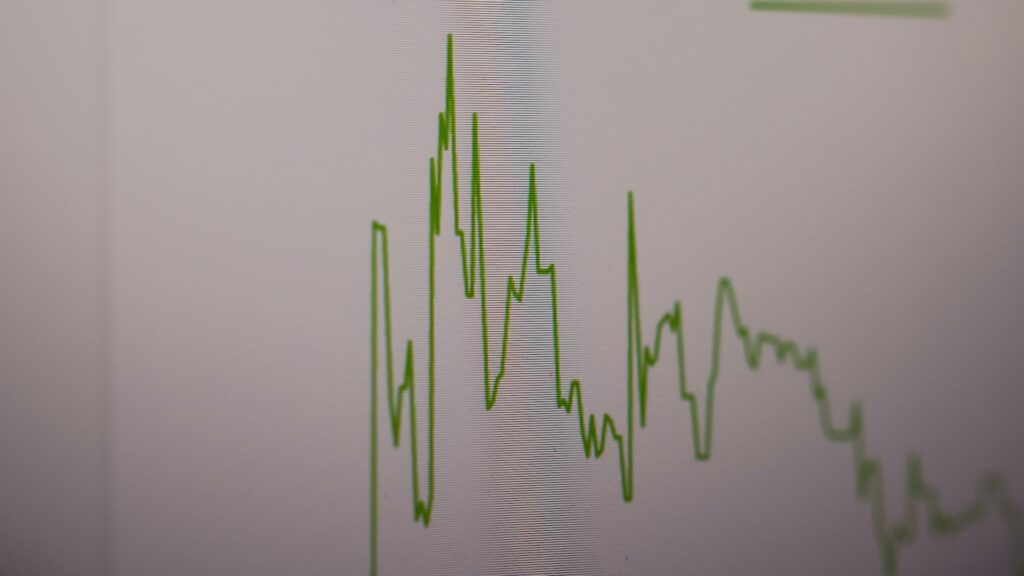
Forex analysis plays a crucial role in helping traders make informed decisions in the dynamic foreign exchange market. Traders utilize various indicators to analyze price movements, identify trends, and predict future market behavior. In this blog post, we will discuss some of the best indicators used in Forex analysis to assist you in enhancing your trading strategies and making more accurate predictions.
Section 1: Trend-Following Indicators
Subsection 1.1: Moving Averages
Moving averages are widely used to identify trends and smooth out price fluctuations. Traders often look at two types of moving averages: the simple moving average (SMA) and the exponential moving average (EMA). SMAs provide a straightforward average of prices over a specific period, while EMAs give more weight to recent data points. Moving averages help traders spot trend reversals, determine support and resistance levels, and generate buy or sell signals.
Subsection 1.2: Average Directional Index (ADX)
The Average Directional Index (ADX) helps traders gauge the strength of a trend. It measures the strength of a trend regardless of its direction. A high ADX value indicates a strong trend, while a low value suggests a weak trend or a range-bound market. Traders can use the ADX to filter out potential trades during low volatility periods and focus on high probability setups during trending markets.
Section 2: Oscillators
Subsection 2.1: Relative Strength Index (RSI)
The Relative Strength Index (RSI) is a popular oscillator that measures the speed and change of price movements. RSI values range from 0 to 100, with readings above 70 considered overbought and readings below 30 considered oversold. Traders use the RSI to identify potential trend reversals, divergences, and overbought or oversold conditions. By combining RSI signals with other technical analysis tools, traders can make more informed trading decisions.
Subsection 2.2: Stochastic Oscillator
The Stochastic Oscillator is another widely used momentum oscillator. It compares the closing price of a currency pair to its price range over a specific period. The Stochastic Oscillator consists of two lines: %K and %D. Readings above 80 indicate overbought conditions, while readings below 20 suggest oversold conditions. Traders look for %K and %D line crossovers, divergences, and support/resistance levels to identify potential trade opportunities.
Section 3: Volatility Indicators
Subsection 3.1: Bollinger Bands
Bollinger Bands consist of a simple moving average and two standard deviation lines placed above and below the moving average. They help traders measure volatility and identify potential price breakouts. When the price is in a narrow range, the Bollinger Bands contract, indicating lower volatility. Conversely, when the price starts to expand and move outside the bands, it suggests increasing volatility and potential trading opportunities.
Subsection 3.2: Average True Range (ATR)
The Average True Range (ATR) indicator measures market volatility by considering the range between the high and low prices of each period. A higher ATR value indicates higher volatility, while a lower value suggests lower volatility. Traders can use the ATR to set stop-loss levels, determine position sizes, and gauge potential profit targets based on the current market volatility.
Section 4: Conclusion
In conclusion, there are various indicators available to assist Forex traders in analyzing price movements and making informed trading decisions. Trend-following indicators such as moving averages and the Average Directional Index (ADX) help identify trends and their strength. Oscillators like the Relative Strength Index (RSI) and Stochastic Oscillator help traders identify overbought or oversold conditions. Volatility indicators such as Bollinger Bands and Average True Range (ATR) aid in measuring market volatility and identifying potential trading opportunities. It is important to note that no single indicator can guarantee successful trading outcomes. Traders should combine multiple indicators and use them in conjunction with other forms of analysis to increase the probability of making accurate predictions and executing profitable trades.