

Introduction
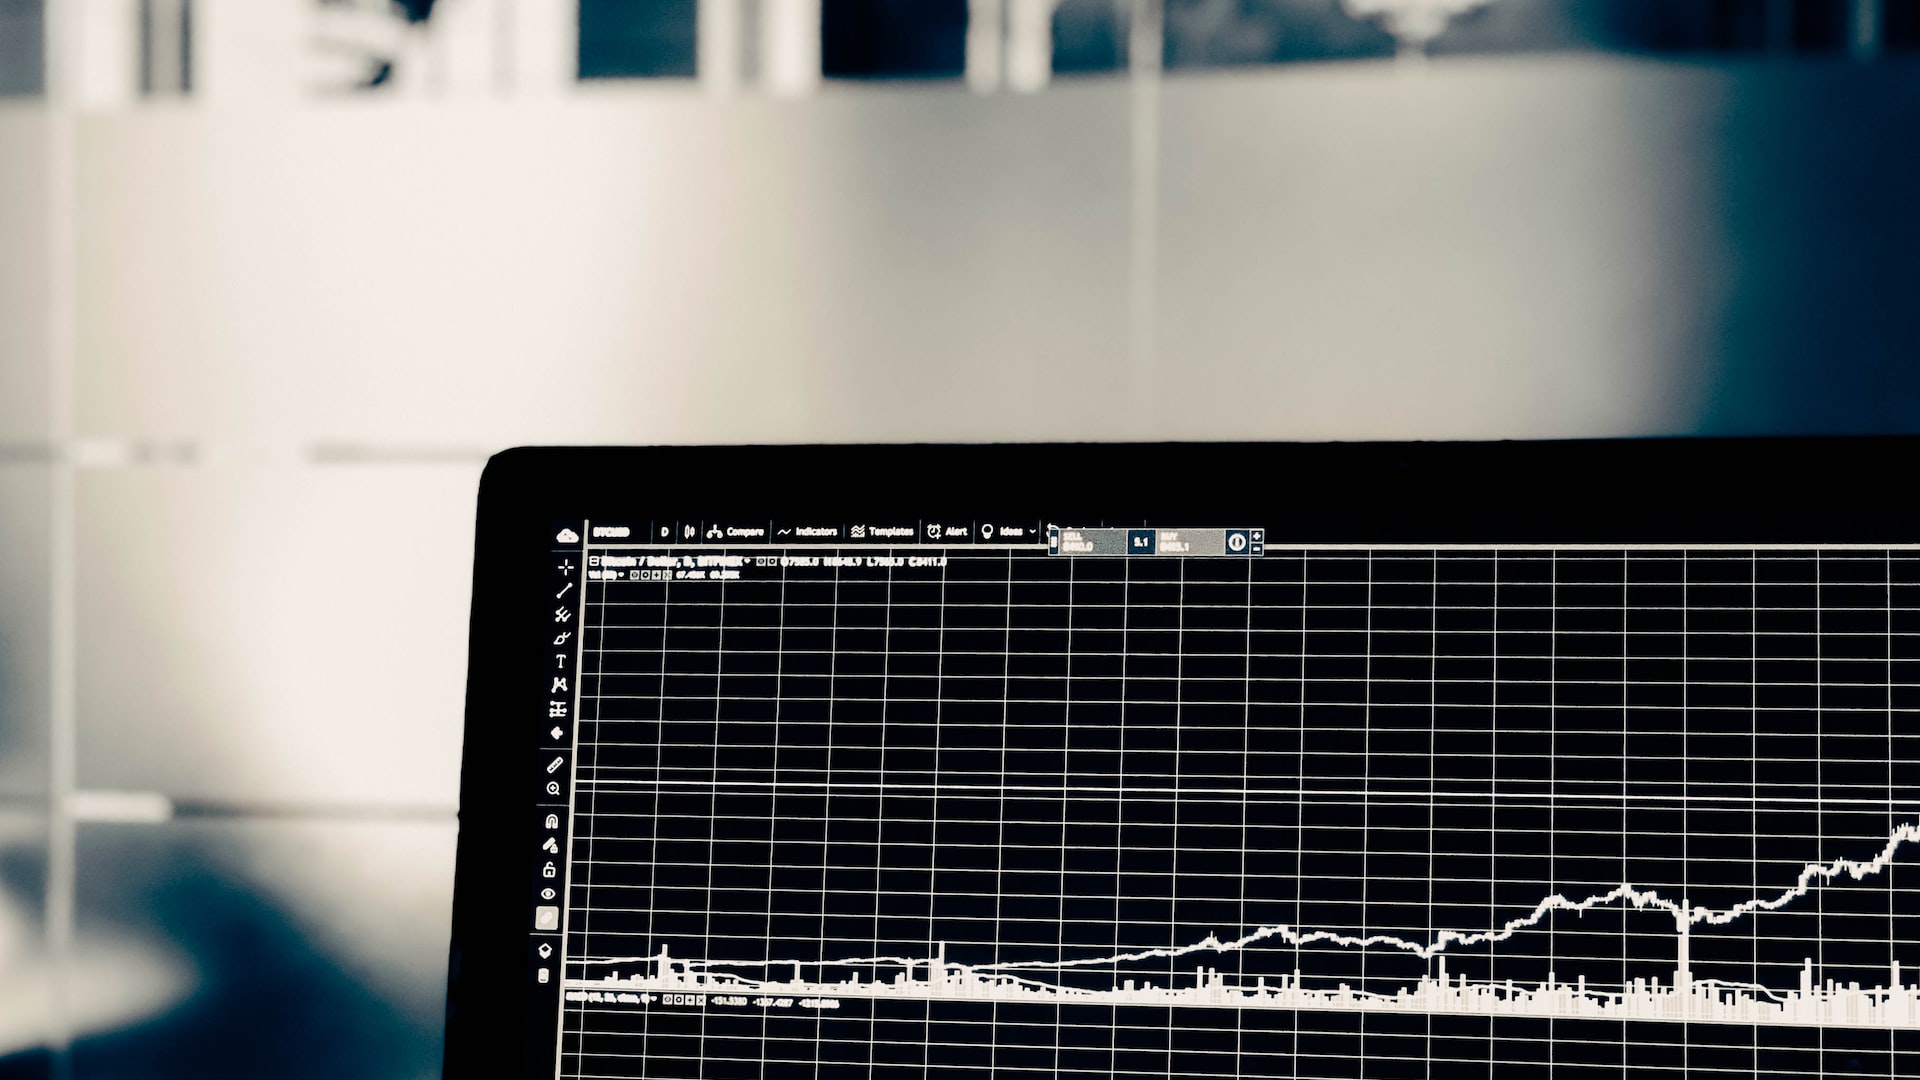
Forex live charts are graphical representations of currency price movements that provide real-time data to traders. These charts are essential tools for analyzing the Forex market and making informed trading decisions. In this blog post, we will explore what Forex live charts are and why they are important for traders.
1. Real-Time Price Visualization
Accurate and Up-to-Date Information
Forex live charts display accurate and up-to-date information on currency prices. Traders can see real-time price movements, including opening, closing, high, and low prices for specific time periods. This real-time visualization helps traders assess market trends and make timely decisions based on the most current market conditions.
Instantaneous Price Analysis
Live charts enable traders to analyze price movements instantly. By observing the patterns and trends on the chart, traders can identify potential entry and exit points, support and resistance levels, and market sentiment. Instantaneous price analysis allows traders to make quick decisions, increasing their chances of profitability.
2. Technical Analysis Tools
Indicators and Overlays
Forex live charts offer a wide range of technical indicators and overlays that help traders analyze price movements. Popular indicators include moving averages, Bollinger Bands, and Relative Strength Index (RSI). These tools provide valuable insights into market trends, momentum, and potential reversals, empowering traders to make informed trading decisions.
Chart Patterns and Formations
Live charts also allow traders to identify chart patterns and formations, such as triangles, head and shoulders, and double tops/bottoms. These patterns can indicate potential trend continuations or reversals, providing traders with valuable signals. By recognizing chart patterns, traders can anticipate market movements and adjust their strategies accordingly.
3. Multiple Timeframes
Granular Analysis
Forex live charts provide traders with the ability to analyze price movements at different timeframes. Traders can zoom in and out and switch between various timeframes, from minute-by-minute to monthly charts. This granular analysis helps traders identify short-term trends within longer-term trends, enabling them to make more accurate predictions.
Validation of Trading Decisions
By using multiple timeframes, traders can validate their trading decisions. For example, if a trader identifies a bullish pattern on a 15-minute chart, they can switch to a higher timeframe, such as a 1-hour or 4-hour chart, to confirm the validity of the pattern. This validation process enhances the reliability of trading decisions.
Conclusion
Forex live charts are powerful tools that provide real-time price visualization, technical analysis capabilities, and the ability to analyze price movements at different timeframes. These charts play a crucial role in helping traders analyze the market, identify trends and patterns, and make informed trading decisions. By utilizing Forex live charts, traders can enhance their trading strategies and increase their chances of success in the dynamic Forex market.