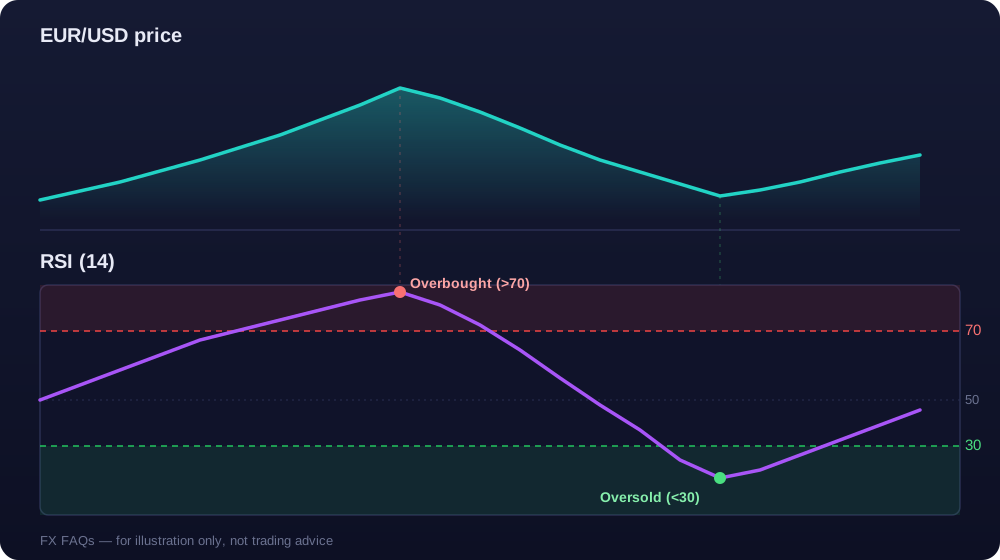
RSI, or the Relative Strength Index, is a technical indicator that measures how fast and how far a currency pair's price has moved recently. It plots on a scale from 0 to 100. When RSI climbs above 70, the pair is considered overbought. When it drops below 30, the pair is considered oversold. Traders use these signals to spot moments when a strong move may be running out of steam.
How It Works
RSI does not look at price directly. It looks at momentum — the speed and size of recent price changes. Over a set number of candles, usually 14, it compares the average size of up moves to the average size of down moves. If up moves have clearly dominated, RSI rises toward 100. If down moves have dominated, RSI falls toward 0. When gains and losses are roughly balanced, RSI settles near 50.
Think of it like a speedometer for a trend. It does not tell you where the price is going next. It tells you how fast the price has been getting there, and whether that pace looks stretched compared to its own recent history.
You will not need to calculate this by hand — every major trading platform plots RSI automatically as a line beneath the price chart. What matters is knowing how to read it once it is on your screen.
RSI plotted below price. The shaded top zone (above 70) marks overbought conditions; the shaded bottom zone (below 30) marks oversold conditions.
Reading Overbought and Oversold Zones
An RSI reading above 70 means recent buying has been unusually strong compared to recent selling. An RSI reading below 30 means the opposite. Many new traders read "overbought" as "sell now" and "oversold" as "buy now." That shortcut causes real losses.
In a strong trend, RSI can sit above 70 for a long stretch while price keeps climbing. Selling early because RSI looks "high" often means exiting — or shorting against — a trend that still has plenty of room left. RSI works best as one piece of context, not a standalone trigger.
A Simple Example
Say EUR/USD has been climbing steadily for two weeks on strong economic data. RSI moves above 70 and stays there. A trader who sells the moment RSI crosses 70 might get stopped out repeatedly as the pair keeps grinding higher. A trader who instead waits for RSI to turn back down from an extreme, or for price to lose a key support level, has more evidence that momentum is actually shifting — not just running hot.
RSI Divergence
Sometimes price makes a new high while RSI makes a lower high. That mismatch is called divergence, and traders watch it as an early warning that momentum is fading even though price is still pushing forward. The reverse can happen too: price makes a new low while RSI makes a higher low, hinting that selling pressure is losing strength. Divergence deserves its own deeper explanation — we cover exactly how to spot and trade it in a separate FAQ.
Using RSI With a Trading Plan
RSI is most useful when it confirms something you already see elsewhere on the chart, rather than acting alone. Traders commonly combine it with:
- The overall trend direction — trading RSI signals in the direction of the larger trend, not against it
- Support and resistance levels — an oversold reading near a strong support zone carries more weight than one in the middle of nowhere
- Other indicators, like a moving average, to confirm the broader picture before acting
Adjusting the RSI Period
The "14" in RSI(14) refers to how many candles the indicator looks back over. Shorter periods, like 7, react faster to recent price swings but throw off more false signals. Longer periods, like 21, move more slowly and filter out noise, at the cost of reacting later to real shifts. Most traders leave RSI at its 14-period default until they have a specific reason to change it.
Why Forex Traders Rely on RSI
Forex pairs trend for long stretches more often than many other markets, driven by interest rate differences and economic cycles that can last months. That makes momentum tools like RSI especially useful — they help traders gauge whether a multi-week trend still has energy behind it, or whether buying and selling pressure has started to even out. It also reacts to the same price data on any timeframe, from a 5-minute chart to a weekly one, so a day trader and a swing trader can both use it, just with different expectations for how often it flags a reading.
Common Misconceptions
"RSI above 70 means sell immediately." Not on its own. In a strong uptrend, RSI can stay overbought for many candles in a row while price keeps rising. Pair the reading with trend direction and support/resistance before acting on it.
"RSI predicts the exact top or bottom." It does not. RSI measures momentum that has already happened. It can flag stretched conditions, but the exact turning point is never guaranteed.
"A shorter RSI period is always more accurate." A shorter period reacts faster but also produces more false signals. A longer period is smoother but slower to react. The standard 14-period setting is a balance most platforms default to for good reason.
Quick Reference
- RSI scale: 0 to 100
- Overbought zone: above 70
- Oversold zone: below 30
- Standard lookback period: 14 candles
- Measures momentum, not price direction
- Works best combined with trend context, not used alone
Related Questions
What is RSI/MACD divergence, and how do you trade it?
What is MACD and how do you read it?
What is the difference between RSI and the Stochastic Oscillator?
Want more forex concepts explained clearly? Join our Telegram community for daily insights and Q&A: https://t.me/+mVscKiyLiekwMzdl