

Introduction
Technical analysis is a widely used approach in forex trading that aims to predict future price movements based on historical market data. Traders who employ technical analysis study charts, patterns, and indicators to identify trends and make informed trading decisions. In this blog post, we will delve into the concept of technical analysis in forex trading.
1. Understanding Technical Analysis
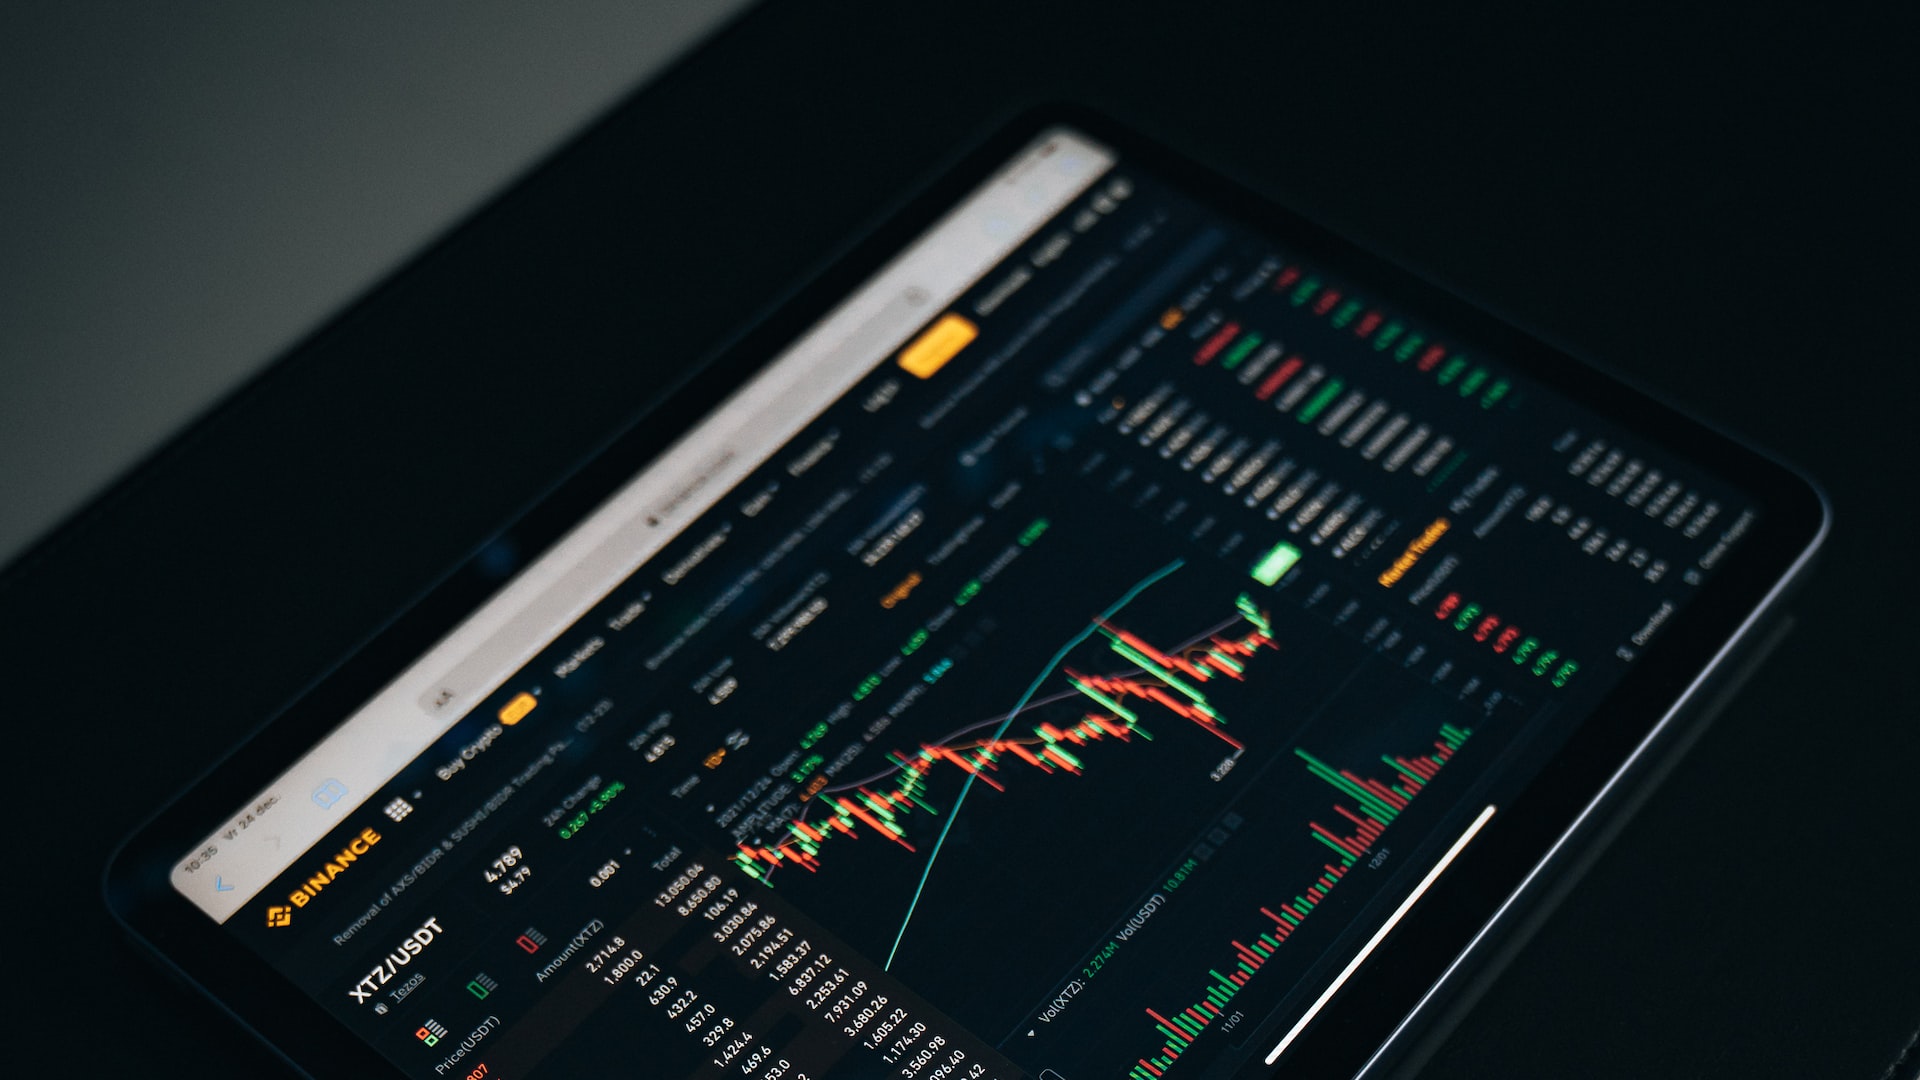
Price Charts
At the core of technical analysis are price charts, which display historical price data over a specific timeframe. Traders analyze these charts to identify patterns, trends, and support and resistance levels. Understanding how to interpret these charts is fundamental to utilizing technical analysis effectively.
Patterns and Trends
Technical analysts look for recurring patterns in price charts, such as head and shoulders, double tops or bottoms, triangles, and more. These patterns can indicate potential reversals or continuation of trends. Additionally, traders analyze trends, which can be upward (bullish), downward (bearish), or sideways (consolidation).
2. Key Concepts in Technical Analysis
Support and Resistance
Support and resistance levels are important concepts in technical analysis. Support levels are price levels where buying pressure is expected to emerge, preventing further downward movement. Resistance levels, on the other hand, are price levels where selling pressure is anticipated, halting further upward movement. Traders use these levels to make decisions about entering or exiting trades.
Indicators
Technical analysts utilize a variety of indicators to assist in their analysis. These indicators are mathematical calculations applied to historical price data to generate insights into potential future price movements. Examples of popular indicators include moving averages, oscillators, and Bollinger Bands. Traders use these indicators to confirm or validate their analysis.
3. Benefits and Limitations of Technical Analysis
Benefits
One of the key benefits of technical analysis is its ability to provide traders with a visual representation of market behavior. By studying charts and patterns, traders can identify potential entry and exit points, manage risk, and set profit targets. Technical analysis can also be applied to various timeframes, allowing traders to adapt their strategies to different trading styles.
Limitations
While technical analysis is widely used, it does have limitations. Technical analysis relies solely on historical price data and does not consider fundamental factors or news events. Additionally, patterns and indicators are subjective and can be open to interpretation, leading to potential false signals. Traders should be aware of these limitations and use technical analysis in conjunction with other forms of analysis.
Conclusion
Technical analysis is a powerful tool in forex trading that allows traders to analyze historical price data, identify patterns, and make informed trading decisions. By studying price charts, recognizing patterns and trends, and utilizing indicators, traders can gain insights into potential future price movements. However, it’s important to understand the benefits and limitations of technical analysis and use it in conjunction with other forms of analysis. With proper application, technical analysis can be a valuable tool for traders seeking to enhance their trading strategies and improve their overall trading performance.